How to Build a Dashboard
Data collected to, processed on Tier0, can be visualized in charts, tables, texts in custom styles and other formats on Tier0 as well.
- Log in to Tier0, and select UNS > Event Flow.
- Click New Event Flow to add a flow.
- Click the flow name to start editing.
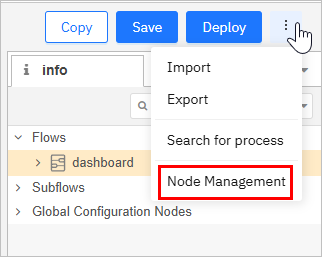
- Click
 at the upper-right corner, and then click Node Management.
- Under Install, search for and install
@flowfuse/node-red-dashboard.

- Use nodes under flowfuse to build a dashboard.
tip
Click  at the upper-right corner, and then click Dashboard2.0 to adjust the layout.

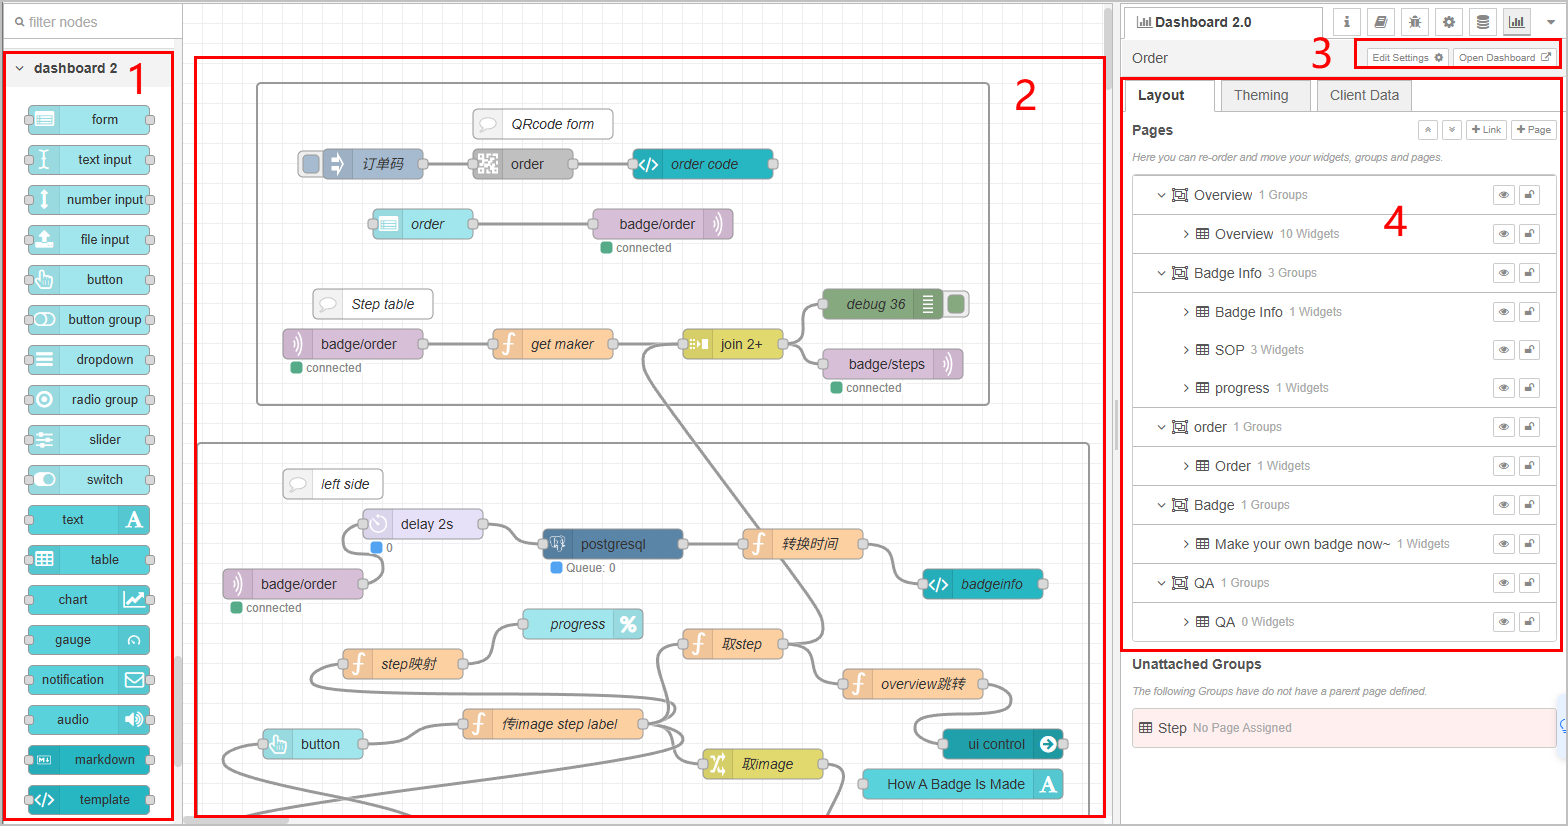
| Index | Item | Description |
|---|---|---|
| 1 | Node | Node of Dashboard 2.0, including gauge, form, progress bar and more. |
| 2 | Canvas | Where you drag in nodes to build a dashboard. |
| 3 | Operations | Edit the ui-base node and view the dashboard. |
| 4 | Layout | Displays all nodes in the corresponding hierarchical layout. |
info
For details on how to use each node, see Flowfuse Node Docs.